
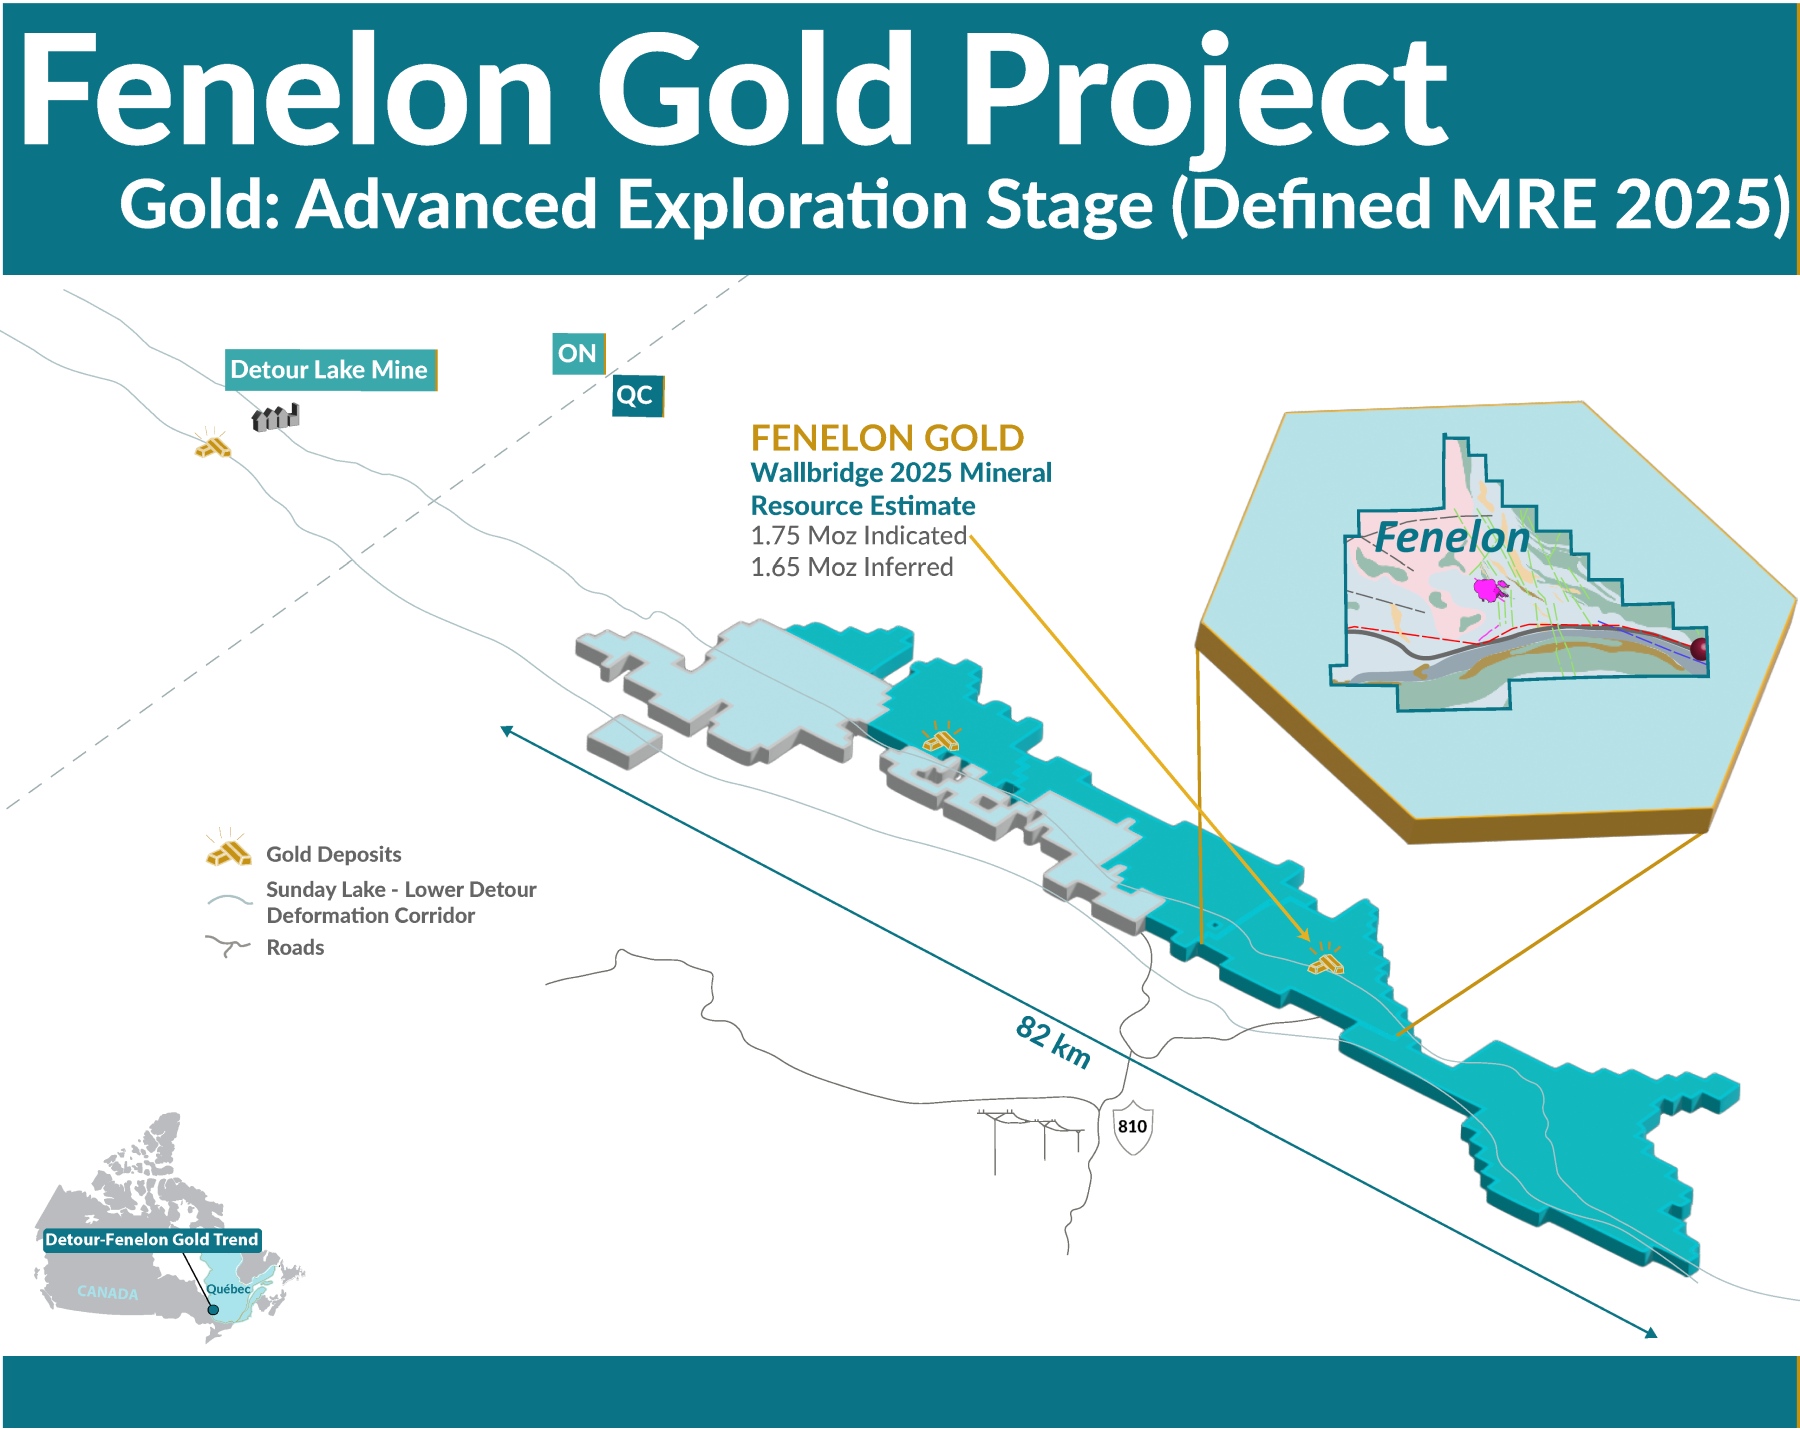
Advanced exploration stage (defined mineral resources)
Detour-Fenelon Gold Trend, ~80 km east of Detour Lake gold mine (Agnico Eagle Mines)
Gold
100% Sunday Lake Gold
1.75 million gold ounces of indicated and 1.65 million gold ounces of inferred mineral resources.
Fenelon Overview
Projects
2025 Mineral Resource Estimate
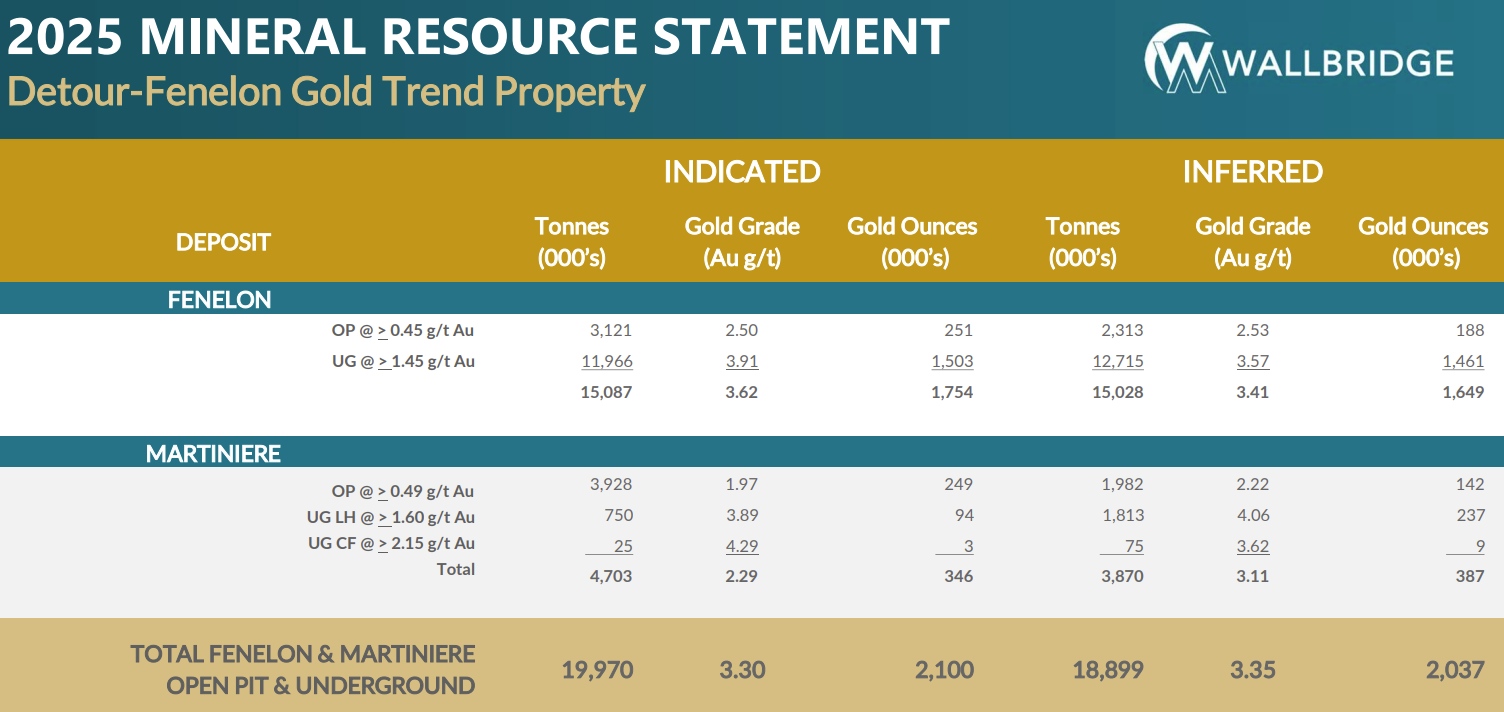
2025 Mineral Resource Notes:
Notes to accompany the Detour-Fenelon Gold Trend Property 2025 Mineral Resource Statement and Mineral Resource Estimates for the Fenelon and Martiniere deposits:
- The effective date of the 2025 MREs is March 20, 2025.
- The 2025 MREs follow CIM Definition Standards (2014) and CIM MRMR Guidelines (2019).
- The qualified person (“QP”) for the 2025 MREs is Mr. Mauro Bassotti (P.Geo.) who is an independent mineral resource consultant.
- The criterion of reasonable prospects for economic extraction has been met by having constraining volumes applied to estimated blocks using GEOVIA Whittle pit optimizer (“Whittle”) softwarefor open pit mineral resources and using Deswik Stope Optimizer (“DSO”) software for underground mineral resources, and by the application of cut-off grades appropriate to the potential miningextraction scenario (i.e., open pit, underground long-hole, underground cut-and-fill). Constraining 3D Whittle open pit and DSO underground stope volumes have been generated based on a goldprice assumption of US$2,150 per troy ounce. A minimum mining width of 2.0 m was used for underground stope optimization.
- The potentially economic open pit shells and underground DSO shapes used for reporting the 2025 MREs have been generated by Mr. Simon Boudreau (P.Eng.), Senior Mining Engineer forInnovExplo Inc., a member of Norda Stelo Inc.
- For the Fenelon deposit, sixteen (16) mineralized domains and four (4) surrounding alteration envelopes were modelled in 3D to the true thickness of the mineralization. Supported bymeasurements, a density value of 2.80 g/cm3 was applied to blocks inside mineralized domains and 2.81 g/cm3 to blocks inside alteration envelopes. High-grade capping was applied to raw assaydata and established on a per-zone basis, ranging between 7 g/t Au and 100 g/t Au for the mineralized domains, and a fixed capping value of 10 g/t Au for the alteration envelopes. One-metre(1.0 m) sample assay composites were calculated within the mineralized domains and alteration envelopes using the grade of the adjacent material when assayed or a value of 0.001 when notassayed.
- For the Martiniere deposit, sixteen (16) mineralized domains and ten (10) surrounding alteration envelopes were modelled in 3D to the true thickness of the mineralization. Supported bymeasurements, the mean density value of the domain was applied to the blocks inside mineralized domains and alteration envelopes, with density values ranging from 2.80 to 3.09 g/cm3. Highgrade capping was applied to raw assay data and established on a per-zone basis, ranging between 15 g/t Au and 100 g/t Au for the mineralized domains, and a fixed capping value of 5 g/t Au forthe alteration envelopes. 1.0 m composites were calculated within the mineralized domains and alteration envelopes using the grade of the adjacent material when assayed or a value of 0.001when not assayed.
- The cut-off grades for the Fenelon deposit were calculated using a gold price of US$2,250/oz; a USD/CAD exchange rate of 1.35; a refining cost of $5.00/t; a processing cost of $30.00/t; amining cost of $5.75/t (bedrock) or $5.95/t (overburden) for the surface portion; a mining cost of $90.00/t for the underground portion; and a G&A cost of $10.00/t. A metallurgical recovery of95.0% and royalty of 4.0% were applied during the cut-off grade calculation.
- The cut-off grades for the Martiniere deposit were calculated using a gold price of US$2,250/oz; a USD/CAD exchange rate of 1.35; a refining cost of $5.00/t; a processing cost of $30.00/t; amining cost of $5.75/t (bedrock) or $5.95/t (overburden) for the surface portion; a mining cost of $125.00/t for the underground portion using the long-hole mining method (“LH”), a mining costof $135.00/t for the underground portion using the cut-and-fill mining method (“CF”); and a G&A cost of $10.00/t. A metallurgical recovery of 85.0% and royalty of 2.0% were applied to the cutoff grade calculation. The metallurgical recovery is based upon a metallurgical characterization study completed in December 2024 (SGS, 2024; Sunday Lake Gold news release dated December 19,2024).
- Tonnage estimates are reported to the nearest 1000 tonnes (000’s). Contained gold are reported to the nearest 1000 troy ounces (000’s).
- These mineral resources are not mineral reserves as they do not have demonstrated economic viability.
- The QP is not aware of any known environmental, permitting, legal, title-related, taxation, sociopolitical or marketing issues, or any other relevant issue, that could materially affect the potentialdevelopment of mineral resources other than those discussed in the 2025 MREs.
- Results are presented in situ. Ounce (troy) = metric tons x grade/31.10348. Any discrepancies in the totals are due to rounding effects; rounding followed the recommendations as per NI 43-101
2025 Preliminary Economic Assessment
On March 27, 2025 an updated Preliminary Economic Assessment was published on the Fenelon project, found here.
PEA Approach
- First principles: new project starting with a clean slate
- Stope optimization: Iterative process to develop a large UG operation according to MRE, rock mechanics and projected stope productivity
- Trade-off studies: material handling, tailings management, mobile equipment
- Capex: Integrate existing infrastructure, approach by phase
- Opex: Detailed evaluation, current (2025) costs; benchmarking against similar operations
PEA Highlights - 16 Year Life of Mine
All results reported in Canadian dollars unless otherwise indicated, assumed gold price of US$2,200/oz gold price.
Annual Gold Production
Ounces
Annual Free Cash Flow
Million
Initial Capital
Million
Sustaining Capital3
Million
Total Cash Cost1,2
US$/oz
AISC2,3
US$/oz
After-tax NPV 1,2 5%
Million
After-tax Internal Rate of Return
Per cent
1. Total cash costs per ounce are operating costs, composed of mining (UG and OP), processing, water treatment and tailings, minesite G&A and royalty costs, divided by payable gold ounces.
2. Non-IFRS financial performance measures with no standardized definition under IFRS.
Sunday Lake Gold has included certain non-IFRS financial measures commonly used in the mining industry in this news release, such as initial capital expenditures, sustaining capital expenditures, total cash costs and all-in sustaining costs, which are not measures recognized under IFRS and do not have a standardized meaning prescribed by IFRS. As a result, these measures may not be comparable to similar measures reported by other companies. Each of these measures used are intended to provide additional information to the user and should not be considered in isolation or as a substitute for measures prepared in accordance with IFRS. Non-IFRS financial measures used in this news release and common to the gold mining industry are defined below.
3. All-in sustaining cost/oz (“AISC”) includes operating costs, sustaining capital expenditures to support the on-going operations, and closure costs, divided by payable gold ounces.
PEA Sensitivity Analysis
| Gold Price | FX | NPV ($M) | IRR | Payback (Years) |
|---|---|---|---|---|
| 1800 (-18%) | 1.35 | 353 | 13% | 5.7 |
| 1900 (-14%) | 1.35 | 443 | 15% | 5.0 |
| 2000 (-9%) | 1.35 | 532 | 17% | 4.6 |
| 2100 (-5%) | 1.35 | 619 | 19% | 4.3 |
| 2200 | 1.35 | 706 | 21% | 4.0 |
| 2300 (+5%) | 1.35 | 792 | 22% | 3.7 |
| 2400 (+9%) | 1.35 | 878 | 24% | 3.4 |
| 2500 (+14%) | 1.35 | 963 | 26% | 3.1 |
| 2600 (+18%) | 1.35 | 1047 | 27% | 2.9 |
| 3000 (+36%) | 1.35 | 1381 | 34% | 2.4 |